Running time calculation
OSRD can be used to perform two types of calculations:
- Standalone train simulation: calculation of the travel time of a train on a given route without interaction between the train and the signalling system.
- Simulation: “dynamic” calculation of several trains interacting with each other via the signalling system.
1 - The input data
A running time calculation is based on 5 inputs:
- Infrastructure: Line and track topology, position of stations and passenger buildings, position and type of points, signals, maximum line speeds, corrected line profile (gradients, ramps and curves).
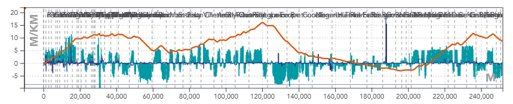
The blue histogram is a representation of the gradients in [‰] per position in [m]. The gradients are positive for ramps and negative for slopes.
The orange line represents the cumulative profile, i.e. the relative altitude to the starting point.
The blue line is a representation of turns in terms of radii of curves in [m].
- The rolling stock: The characteristics of which needed to perform the simulation are shown below.
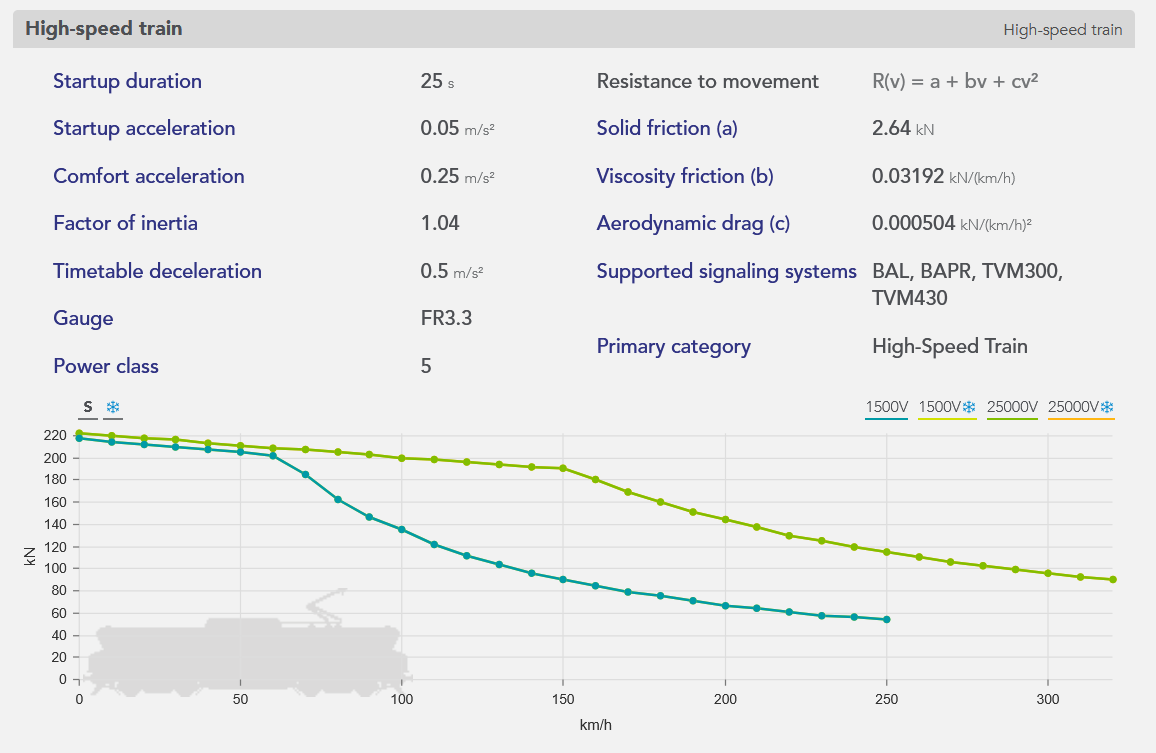
The orange curve, called the effort-speed curve, represents the maximum motor effort as a function of the speed of travel.
The length, mass, and maximum speed of the train are shown at the bottom of the box.
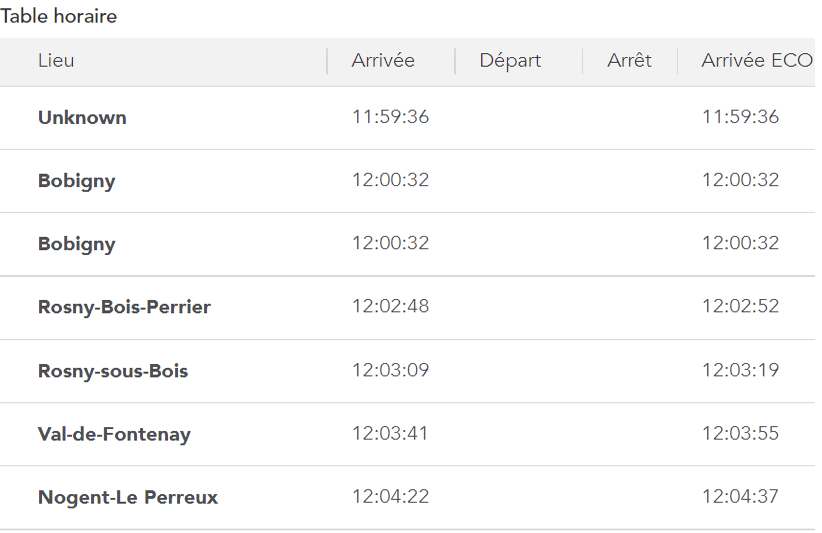
The departure time is then used to calculate the times of passage at the various points of interest (including stations).
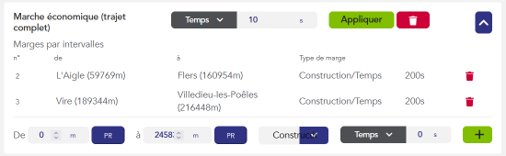
Allowances: Time added to the train’s journey to relax its running (see page on allowances).
- The time step for the calculation of numerical integration.
2 - The results
The results of a running time calculation can be represented in different forms:
- The space/time graph (GET): represents the path of trains in space and time, in the form of generally diagonal lines whose slope is the speed. Stops are shown as horizontal plates.
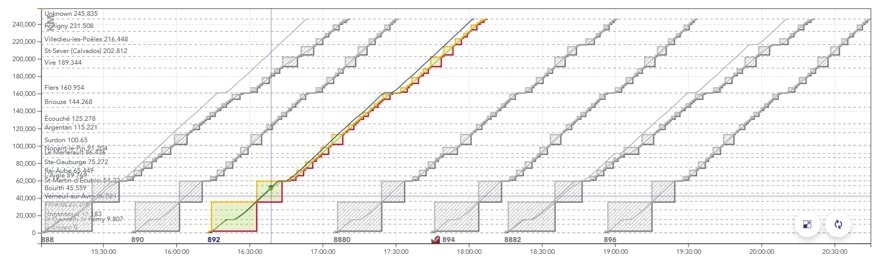
Example of a GET with several trains spaced about 30 minutes apart.
The x axis is the time of the train, the y axis is the position of the train in [m].
The blue line represents the most tense running calculation for the train, the green line represents a relaxed, so-called “economic” running calculation.
The solid rectangles surrounding the paths represent the portions of the track successively reserved for the train to pass (called blocks).
- The space/speed graph (SSG): represents the journey of a single train, this time in terms of speed. Stops are therefore shown as a drop in the curve to zero, followed by a re-acceleration.
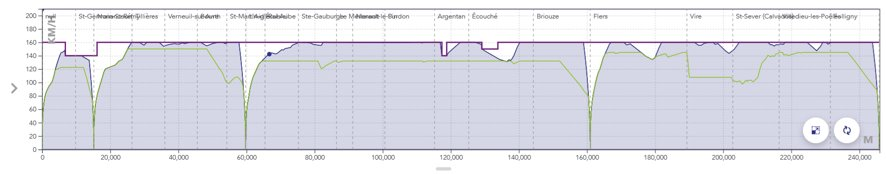
The x axis is the train position in [m], the y axis is the train speed in [km/h].
The purple line represents the maximum permitted speed.
The blue line represents the speed in the case of the most stretched running calculation.
The green line represents the speed in the case of the “economic” travel calculation.
- The timetable for the passage of the train at the various points of interest.